
STATS // GDP by Census Metropolitan Area (2016)
GDP BY CENSUS METROPOLITAN AREA, 2016
Today, Statistics Canada released Gross Domestic Product (GDP) data for Canada’s Census Metropolitan Areas (CMAs) and the areas outside of CMAs for 2016 and revised previous estimates for 2009-2015. All data are benchmarked to provincial nominal GDP at basic prices.
These results continue to show that just over half of Canada’s GDP is generated in the six CMAs: Toronto, Montréal, Vancouver, Calgary, Edmonton and Ottawa–Gatineau. Like population, economic activities primarily focus in cities. In 2016, CMAs accounted for 71.1 per cent of Canada’s population and generated about 74.4 per cent of Canadian GDP. In Nova Scotia, Halifax accounted for 43.9 per cent of provincial population and 54.4 per cent of provincial GDP.
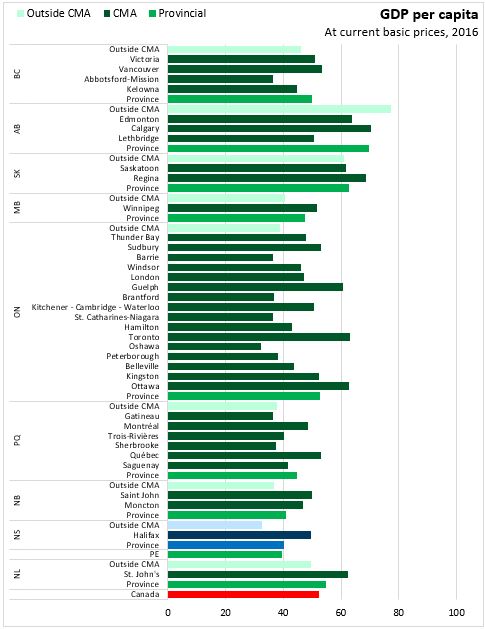
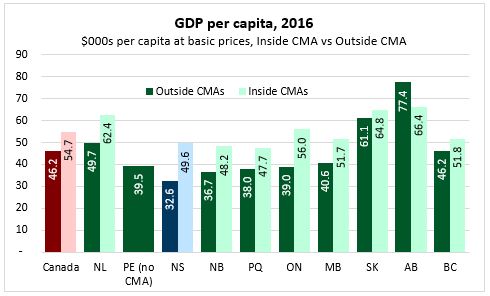
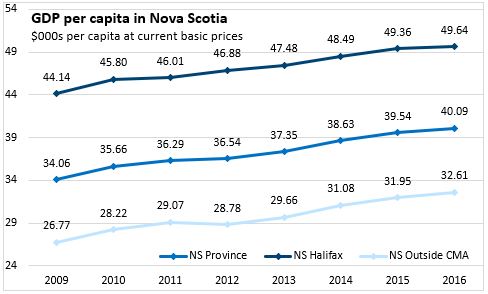
Overall in 2016, GDP per capita in reported CMAs was $54,683. Halifax’s GDP per capita was $49,638. Across Canada, the largest GDP per capita among CMAs is reported in Calgary, Regina, Edmonton and Toronto. However, results may be sensitive to fluctuations in commodity prices. The lowest GDP per capita among reported CMAs was observed in Oshawa ($32,259).
Outside CMAs, GDP per capita was $46,217. The highest non-CMA GDP per capita was observed in Alberta at $77,383 (higher than CMA GDP per capita) while the lowest was reported for Nova Scotia ($32,613). Per capita GDP outside Canada’s reported CMAs averaged 85.6 per cent of CMA GDP per capita.
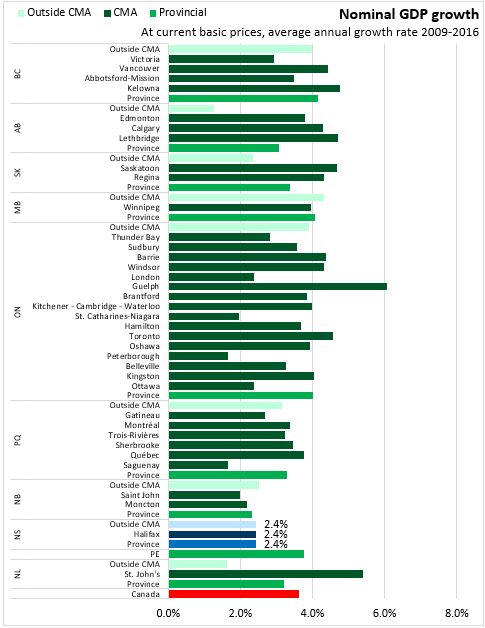
From 2009-2016, GDP growth has averaged 3.9 per cent inside CMAs and 2.9 per cent outside CMAs. Halifax’s GDP grew by 2.4 per cent on average over this period, the same pace of growth for Nova Scotia outside Halifax. The fastest growing economies over this period were observed in Guelph, St. John’s, Kelowna and Lethbridge. GDP growth outside CMAs was faster in Manitoba, Ontario and British Columbia.
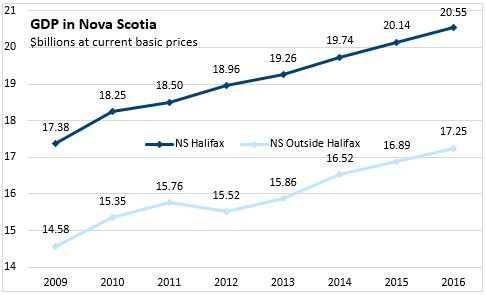
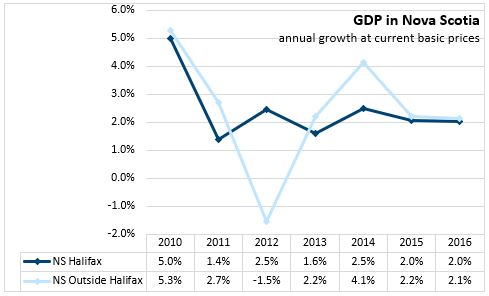
Nova Scotia’s GDP in 2016 was $37.80 billion, of which $20.55 billion was generated in Halifax and $17.25 billion was generated outside of Halifax. GDP has been rising in both Halifax and the rest of the province, but growth outside the city has been faster for all years except 2012, when two paper mills were shuttered.
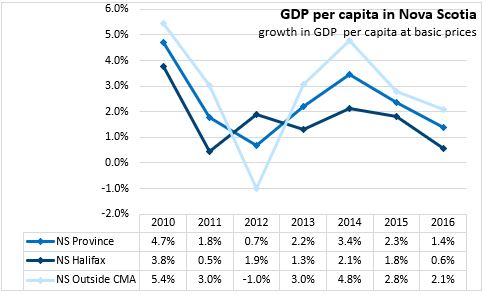
On a per capita basis, GDP in Halifax remains significantly higher than in the rest of Nova Scotia. However, except for 2012, per capita GDP growth outside Halifax has been faster than inside Halifax, narrowing the gap in GDP per capita between urban and rural areas of the province.
Source: Statistics Canada. Table 36-10-0468-01 Gross domestic product (GDP) at basic prices, by census metropolitan area (CMA) (x 1,000,000); Table 17-10-0135-01 Population estimates, July 1, by census metropolitan area and census agglomeration, 2016 boundaries; Table 17-10-0005-01 Population estimates on July 1st, by age and sex